Example Gallery
Simple Examples
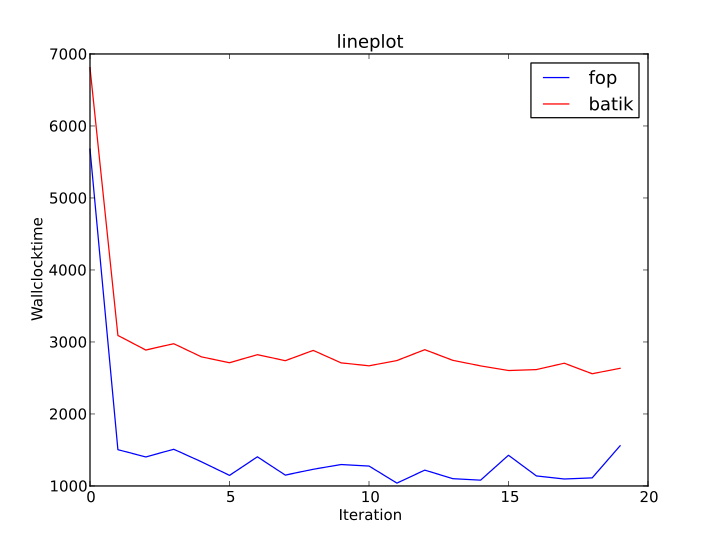
Lineplot
A simple lineplot, which can also be found in docs/examples/lineplot.job:
1 2 3 4 5 6 7 8 9 10 11 12 13 14 15 16 17 18 19 20 21 22 23 24 25 26 27 28 29 30 31 32 33 34 35 36 37 38 39 40 41 42 43 44 45 46 | # -*- mode: python -*-
# This example shows how to create a lineplot
# showing the wallclocktime of multiple iterations
# and benchmarks.
from penchy.jobs import *
node = NodeSetting('192.168.56.10', 22, 'bench', '/home/bench', '/usr/bin')
benchmarks = ['fop', 'batik']
# Client side filters
f = filters.DacapoHarness()
unpack = filters.Unpack(input='times', output='values')
send = filters.Send()
num = filters.Enumerate()
comps = []
for bench in benchmarks:
jvm = jvms.JVM('java')
jvm.workload = workloads.ScalaBench(bench, iterations=20)
comp = SystemComposition(jvm, node)
comp.flow = [
jvm.workload >> 'stderr'
>> f >> 'times'
>> unpack
>> num >> [('values', 'times'), ('numbers', 'iter')]
>> send
]
comps.append(comp)
# Server side filters
merge = filters.MergingReceive(('time', 'iter', 'bench'),
[(com, 'times', 'iter', filters.Value(bench)) for com, bench in
zip(comps, benchmarks)])
# Plotting
plot = plots.LinePlot(filename='/tmp/lineplot.png', title='lineplot',
xlabel='Iteration', ylabel='Wallclocktime')
job = Job(compositions=comps,
server_flow=[
merge >> [('iter', 'x'), ('time', 'y'), ('bench', 'z')] >> plot
]
)
|
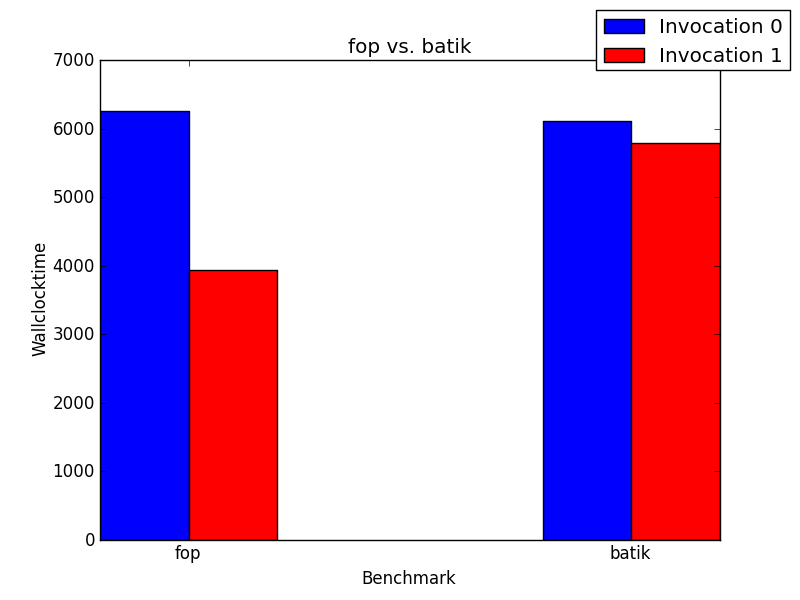
Barplot
A simple barlot, which can also be found in docs/examples/barplot.job:
1 2 3 4 5 6 7 8 9 10 11 12 13 14 15 16 17 18 19 20 21 22 23 24 25 26 27 28 29 30 31 32 33 34 35 36 37 38 39 40 41 42 43 44 45 46 47 48 49 50 51 52 53 54 55 56 57 58 59 | # -*- mode: python -*-
# This example shows how to create a barplot
# showing the wallclocktime of multiple
# invocations and benchmarks, but with a single
# iteration per invocation.
from penchy.jobs import *
node = NodeSetting('192.168.56.10', 22, 'bench', '/home/bench', '/usr/bin')
jvm1 = jvms.JVM('java')
jvm2 = jvms.JVM('java')
comp1 = SystemComposition(jvm1, node)
comp2 = SystemComposition(jvm2, node)
fop = workloads.ScalaBench('fop')
batik = workloads.ScalaBench('batik')
jvm1.workload = fop
jvm2.workload = batik
f = filters.DacapoHarness()
unpack = filters.Map(filters.Unpack())
enum = filters.Enumerate()
deco = filters.Decorate("Invocation {0}")
send = filters.Send()
merge = filters.MergingReceive(('time', 'bench'),
[(comp1, 'times', Value('fop')),
(comp2, 'times', Value('batik'))])
extract = filters.ExtractingReceive('invoc')
plot = plots.BarPlot(filename='/tmp/barplot.png', title='fop vs. batik',
xlabel='Benchmark', ylabel='Wallclocktime')
comp1.flow = [
fop >> 'stderr'
>> f >> ('times', 'values')
>> unpack
>> enum >> [('numbers', 'invoc'), ('values', 'times')]
>> send
]
comp2.flow = [
batik >> 'stderr'
>> f >> ('times', 'values')
>> unpack
>> enum >> [('numbers', 'invoc'), ('values', 'times')] >>
send
]
job = Job(compositions=[comp1, comp2],
server_flow=[
merge >> [('bench', 'x'), ('time', 'y')] >> plot,
extract >> ('invoc', 'values') >> deco >> ('values', 'z') >> plot
],
invocations=2
)
|
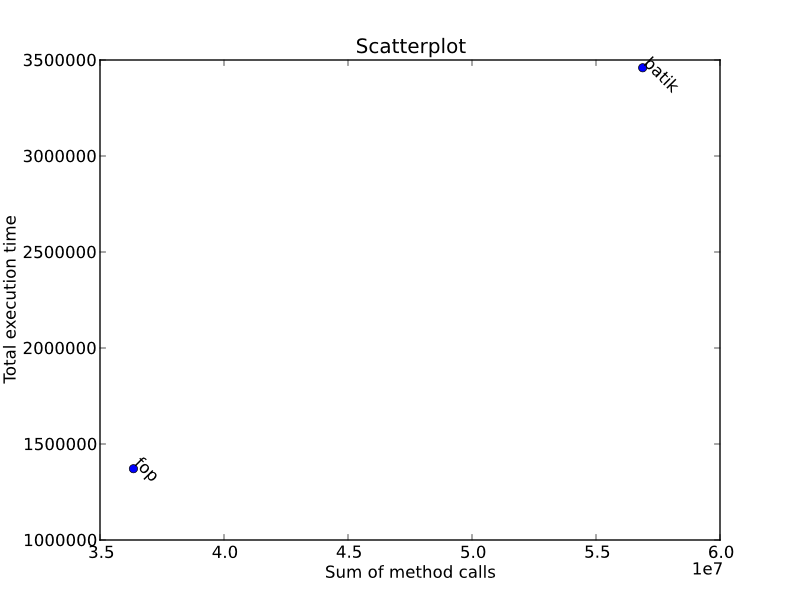
Scatterplot
A simple barlot, which can also be found in docs/examples/scatterplot.job:
1 2 3 4 5 6 7 8 9 10 11 12 13 14 15 16 17 18 19 20 21 22 23 24 25 26 27 28 29 30 31 32 33 34 35 36 37 38 39 40 41 42 43 44 | # -*- mode: python -*-
# This example shows how to create a scatterplot
# showing the sum of method calls and the total
# execution time for different benchmarks.
# (Only one iteration and invocation.)
from penchy.jobs import *
node = NodeSetting('192.168.56.10', 22, 'bench', '/home/bench', '/usr/bin')
benchmarks = ['fop', 'batik']
# Client side filters
f = filters.HProfCpuTimes()
send = filters.Send()
compositions = []
for bench in benchmarks:
jvm = jvms.JVM('java')
jvm.workload = workloads.ScalaBench(bench)
jvm.tool = tools.HProf('cpu=times')
composition = SystemComposition(jvm, node)
composition.flow = [jvm.tool >> f >> ('count', 'values') >>
filters.Map(filters.Sum()) >> ('values', 'sum') >> send,
f >> 'total' >> send]
compositions.append(composition)
# Server side filters
merge = filters.MergingReceive(('sum', 'total', 'bench'),
[(composition, 'sum', 'total', Value(bench))
for composition, bench in zip(compositions,
benchmarks)])
plot = plots.ScatterPlot(filename='/tmp/scatterplot.svg',
title='Scatterplot',
xlabel='Sum of method calls',
ylabel='Total execution time')
job = Job(compositions=compositions,
server_flow=[
merge >> [('bench', 'labels'), ('sum', 'x'), ('total', 'y')] >> plot
],
invocations = 1)
|
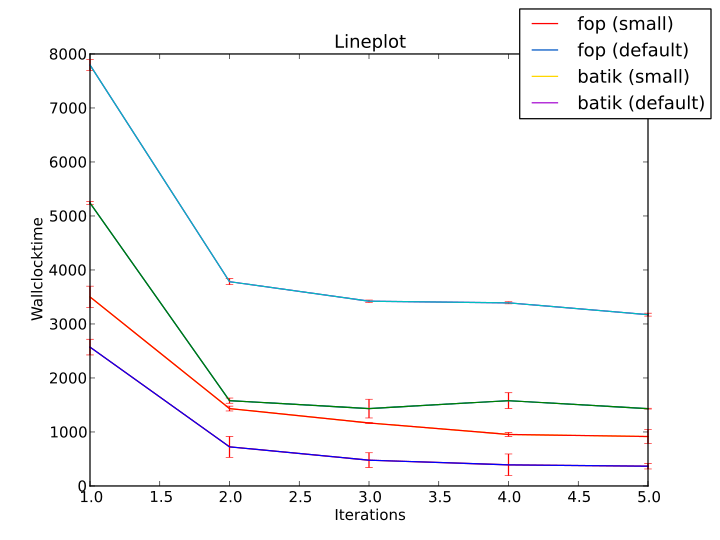
More Complex Examples
Lineplot
A simple lineplot, which can also be found in docs/examples/lineplot.job:
1 2 3 4 5 6 7 8 9 10 11 12 13 14 15 16 17 18 19 20 21 22 23 24 25 26 27 28 29 30 31 32 33 34 35 36 37 38 39 40 41 42 43 44 45 | # -*- mode: python -*-
from penchy.jobs import *
node = NodeSetting('192.168.56.10', 22, 'bench', '/home/bench', '/usr/bin')
benchmarks = [('fop', 'small'),
('fop', 'default'),
('batik', 'small'),
('batik', 'default')]
# Client side filters
mean = filters.Mean()
std = filters.StandardDeviation()
flip = filters.Zip()
send = filters.Send()
compositions = []
for benchmark, size in benchmarks:
jvm = JVM('java')
jvm.workload = workloads.ScalaBench(benchmark, iterations=5, args="--size " + size,
name=benchmark + " (" + size + ")")
comp = SystemComposition(jvm, node)
comp.flow = [jvm.workload >> 'stderr' >> filters.DacapoHarness() >> ('times', 'values') >>
flip >> filters.Map(mean) >> ('values', 'times') >> send,
flip >> filters.Map(std) >> ('values', 'std') >> send,
flip >> filters.Map(mean) >> filters.Enumerate(start=1) >> send]
compositions.append(comp)
# Server side filters
merge = filters.MergingReceive(('time', 'std', 'iter', 'bench'),
[(comp, 'times', 'std', 'numbers', Value(str(comp.jvm.workload))) for comp in compositions])
plot = plots.LinePlot(filename='/tmp/lineplot.svg', title='Lineplot', yerror_bars=True,
xlabel='Iterations',ylabel='Wallclocktime')
job = Job(compositions=compositions,
server_flow=[
merge >> [('iter', 'x'), ('time', 'y'), ('bench', 'z'), ('std', 'yerr')] >> plot,
],
invocations = 3
)
|
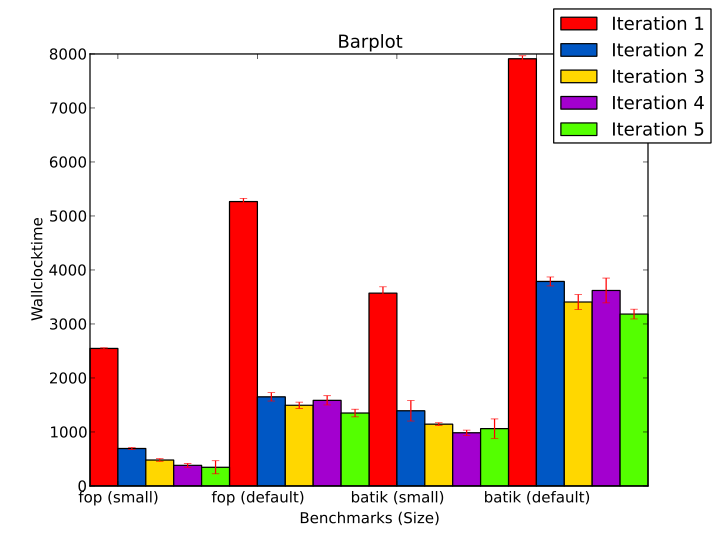
Barplot
A simple barlot, which can also be found in docs/examples/barplot.job:
1 2 3 4 5 6 7 8 9 10 11 12 13 14 15 16 17 18 19 20 21 22 23 24 25 26 27 28 29 30 31 32 33 34 35 36 37 38 39 40 41 42 43 44 45 46 47 | # -*- mode: python -*-
from penchy.jobs import *
node = NodeSetting('192.168.56.10', 22, 'bench', '/home/bench', '/usr/bin')
benchmarks = [('fop', 'small'),
('fop', 'default'),
('batik', 'small'),
('batik', 'default')]
# Client side filters
mean = filters.Mean()
std = filters.StandardDeviation()
flip = filters.Zip()
send = filters.Send()
compositions = []
for benchmark, size in benchmarks:
jvm = JVM('java')
jvm.workload = workloads.ScalaBench(benchmark, iterations=5, args="--size " + size,
name=benchmark + " (" + size + ")")
comp = SystemComposition(jvm, node)
comp.flow = [jvm.workload >> 'stderr' >> filters.DacapoHarness() >> ('times', 'values') >>
flip >> filters.Map(mean) >> ('values', 'times') >> send,
flip >> filters.Map(std) >> ('values', 'std') >> send]
compositions.append(comp)
# Server side filters
merge = filters.MergingReceive(('time', 'std', 'bench'),
[(comp, 'times', 'std', Value(str(comp.jvm.workload))) for comp in compositions])
extract = filters.ExtractingReceive('times')
deco = filters.Decorate('Iteration {0}')
enum = filters.Enumerate(start=1)
plot = plots.BarPlot(filename='/tmp/barplot.svg', title='Barplot', error_bars=True,
xlabel='Benchmarks (Size)',ylabel='Wallclocktime')
job = Job(compositions=compositions,
server_flow=[
merge >> [('bench', 'x'), ('time', 'y'), ('std', 'err')] >> plot,
extract >> ('times', 'values') >> enum >> ('numbers', 'values') >> deco >> ('values', 'z') >> plot
],
invocations = 3
)
|
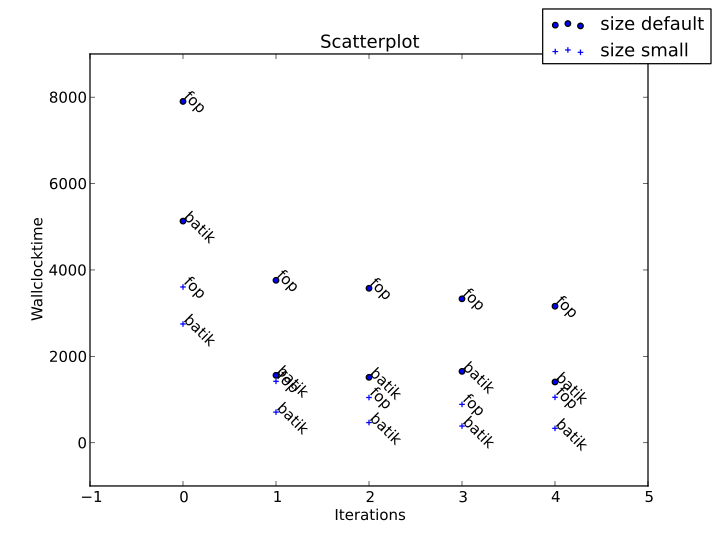
Scatterplot
1 2 3 4 5 6 7 8 9 10 11 12 13 14 15 16 17 18 19 20 21 22 23 24 25 26 27 28 29 30 31 32 33 34 35 36 37 38 39 40 41 42 43 44 45 | # -*- mode: python -*-
from penchy.jobs import *
node = NodeSetting('192.168.56.10', 22, 'bench', '/home/bench', '/usr/bin')
benchmarks = [('fop', 'small'),
('fop', 'default'),
('batik', 'small'),
('batik', 'default')]
# Client side filters
mean = filters.Mean()
std = filters.StandardDeviation()
flip = filters.Zip()
send = filters.Send()
compositions = []
for benchmark, size in benchmarks:
jvm = JVM('java')
jvm.workload = workloads.ScalaBench(benchmark, iterations=5, args="--size " + size,
name=benchmark)
comp = SystemComposition(jvm, node)
comp.flow = [jvm.workload >> 'stderr' >> filters.DacapoHarness() >> ('times', 'values') >>
flip >> filters.Map(mean) >> ('values', 'times') >> send,
flip >> filters.Map(mean) >> filters.Enumerate() >> send]
compositions.append(comp)
# Server side filters
merge = filters.MergingReceive(('time', 'iter', 'bench', 'size', 'legend'),
[(c, 'times', 'numbers', Value(str(c.jvm.workload)),
Value('o' if 'small' in c.jvm.workload.args else '+'),
Value(c.jvm.workload.args.strip('--'))) for c in compositions])
plot = plots.ScatterPlot(filename='/tmp/scatterplot.svg', title='Scatterplot', markers=True,
xlabel='Iterations',ylabel='Wallclocktime')
job = Job(compositions=compositions,
server_flow=[
merge >> [('iter', 'x'), ('time', 'y'), ('bench', 'labels'),
('size', 'markers'), 'legend'] >> plot,
],
invocations = 3
)
|